

Operational verification
Records that staff reached the right point, completed the right form and that the task closed with evidence.
- Dynamic QR + location
- Form, measurement and photo
- Delays, SLAs and work orders
Industry approach
SCQ verifies that the service was really delivered in the field, measures how users experienced it and brings both results together in the same management decision.

Choose your industry

Uninterrupted hygiene and support services
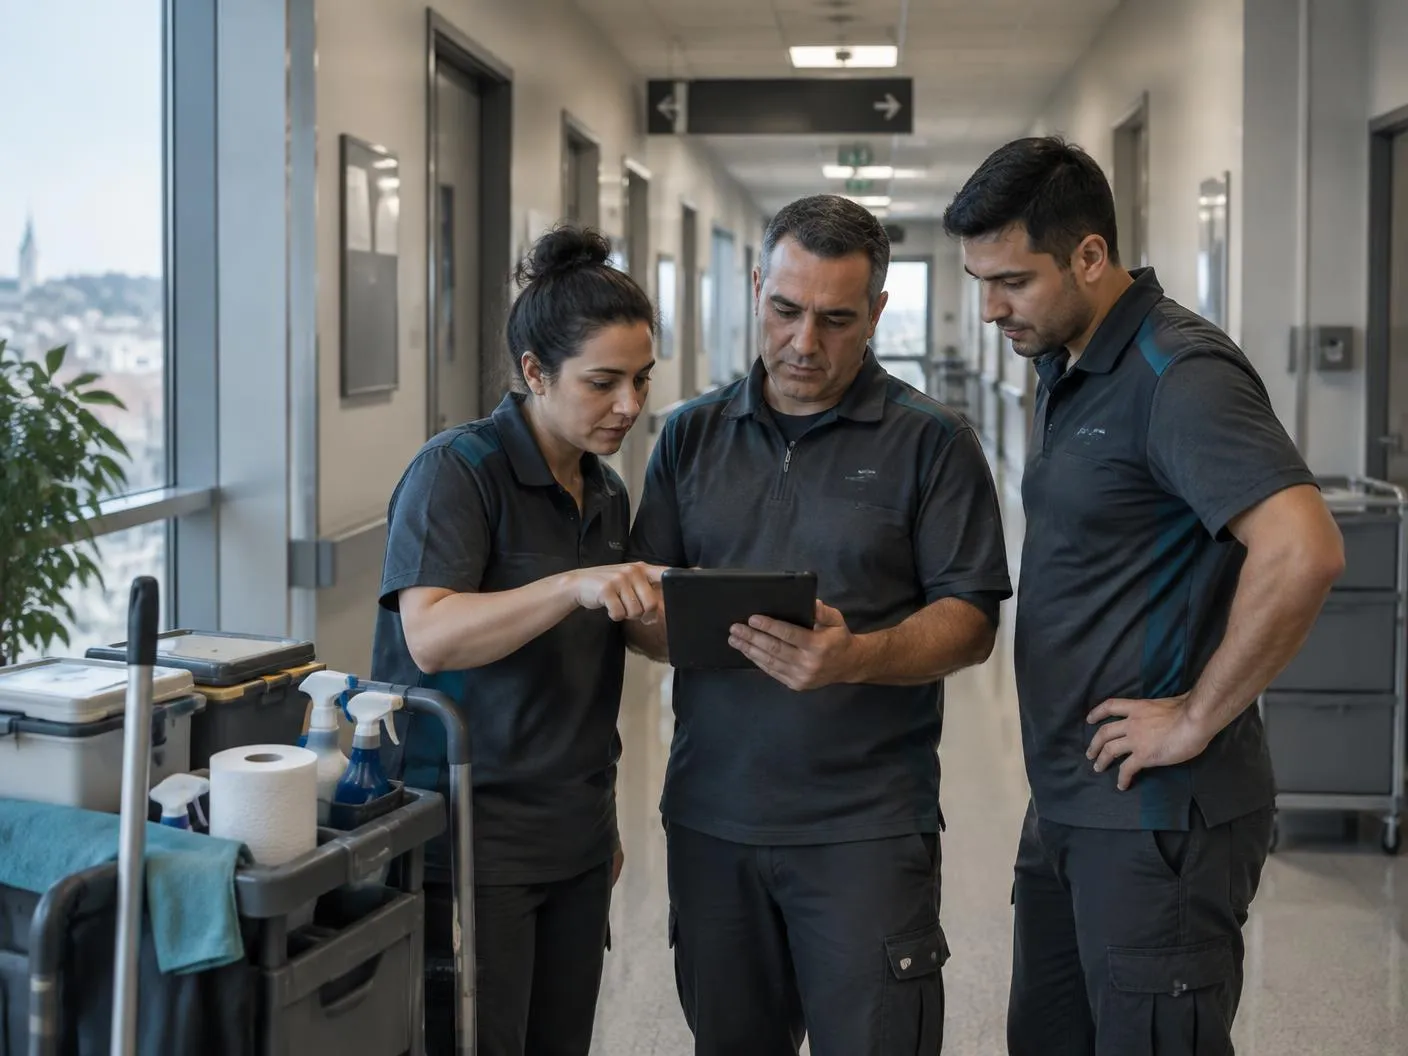
In heavily used patient and visitor areas the service standard can slip quickly, even when a task record exists.
“Was the critical area checked on time, and how did users experience the same area?”
Critical service points
Suggested field flow
Verify the right area with a dynamic QR
Record the hygiene form, measurements and photos
Assign the nonconformity to a team with an SLA
Match patient relatives' feedback to the same location
Management output
Hospital · use cases and workflows
Frequent checks → hygiene form with photos → 15 min SLA on nonconformity
Route scan → fill-level record → collection work order
Room QR → checklist → room-ready notification
Equipment QR → mandatory measurement → out-of-limit work order
Detailed solution pages
All solutions
Visible service in common areas
Many points and subcontracted teams mean a skipped task is only noticed at the end of the shift.
“On which floor, in which shift and at which service point did continuity break?”
Critical service points
Suggested field flow
Link shift tasks to locations
Verify the staff member's physical presence
Notify the manager of delays instantly
Compare the visitor signal with the task record
Management output
Mall & Facility · use cases and workflows
Every 45 min → QR scan → matched with visitor rating
Daily round → fault category → assignment to the technical team
Zone round → lighting/cleaning record → work order for gaps
SLA tasks → independent record → month-end report per company
Detailed solution pages
Connect the guest experience to operations
Small deviations in room and common-area checks show up directly in the guest experience.
“Was the service done, and if so, did the result meet the quality the guest expects?”
Critical service points
Suggested field flow
Open the room or area task with a QR
Complete the standard checklist
Route the gap to the right department
Combine the guest rating with the operation record
Management output
Hotel · use cases and workflows
Room QR → standard list → supervisor approval
Measurement (chlorine/pH) → out-of-limit alert → technical response
Start-of-shift check → photo → nonconformity closure
Guest 1–5 rating → diagnosis → task for the right department

Record integrity in critical checks
A periodic check closed at the wrong point or with missing data creates operational and audit risk.
“Was the right equipment really checked at the right time, with the mandatory measurements?”
Critical service points
Suggested field flow
Verify the equipment with a dynamic QR
Make measurements, checks and photos mandatory
Turn out-of-limit values into actions
Keep the audit record tamper-proof
Management output
Factory & Energy · use cases and workflows
Equipment QR → mandatory measurement → out-of-tolerance work order
Sequential round → pressure photo → missing equipment record
Zone check form → risk photo → action for the owner
Door reader → corridor passages → transfer to timesheets
Time & attendance · physical movement verification
Staff movements at gates and along long transit areas are written to the timeline through verification points.
Today · Staff #102408:00–17:00
Sent to timesheets automatically
Central control over a distributed site
Large areas and high task volumes make delays and gaps in responsibility hard to see from the centre.
“Which of the distributed teams fell behind the critical service level?”
Critical service points
Suggested field flow
Split points by zone and service level
Verify the field visit with QR and location
Match delays to teams and SLAs
Compare stations in the central view
Management output
Airport & Campus · use cases and workflows
Frequency by footfall → QR → passenger rating
Round mode → missed point alert → zone report
Equipment QR → check form → fault work order
Shift check → student/staff feedback → action
One product, two decision layers
Records that staff reached the right point, completed the right form and that the task closed with evidence.
Compares 1–5 ratings and issue categories at the same service point with the verified task record.
From evidence to decision
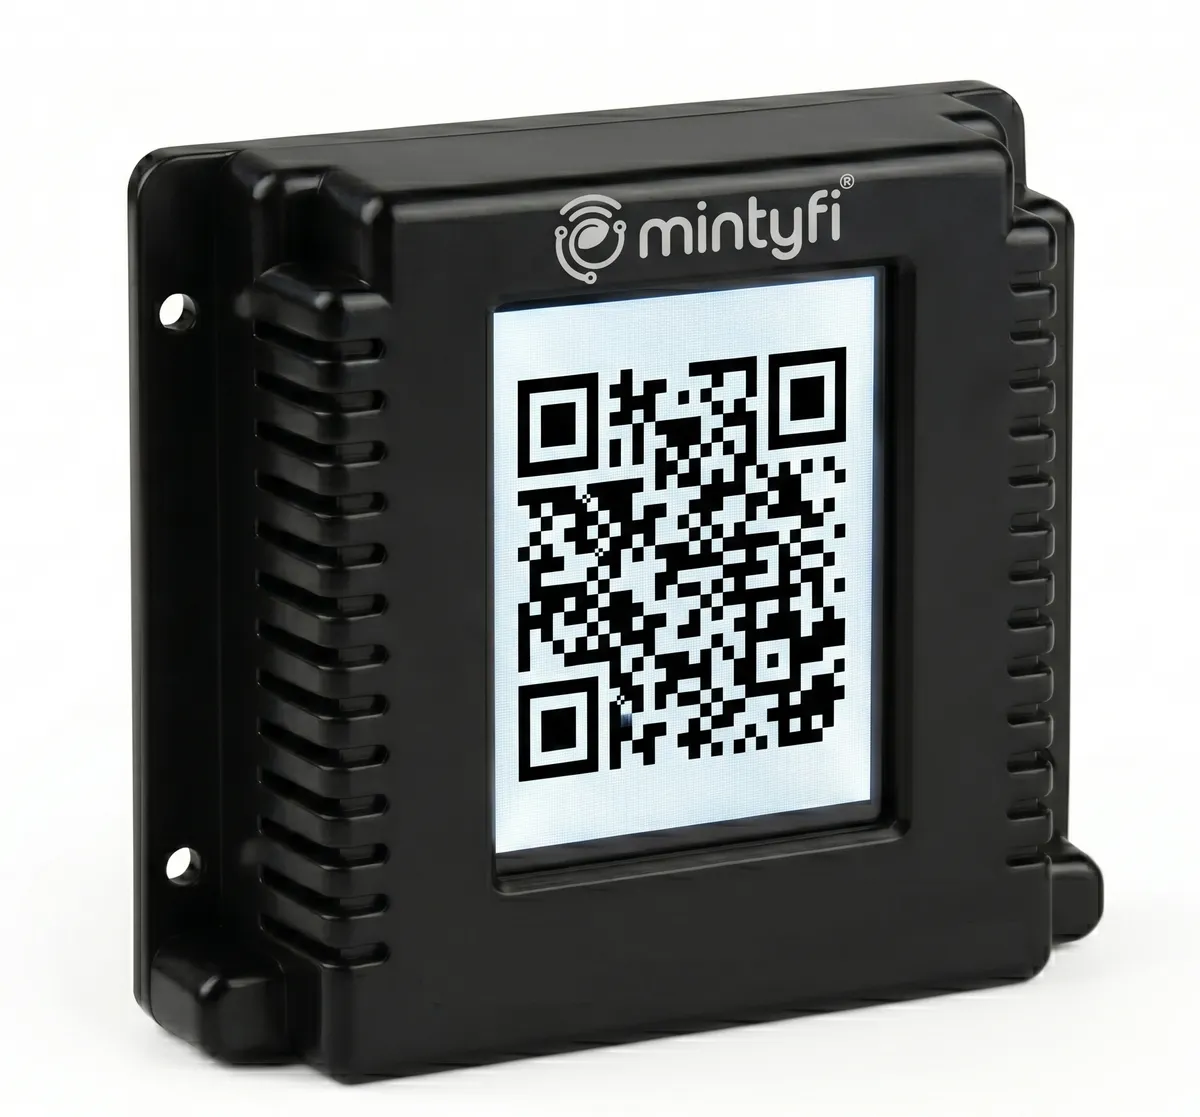
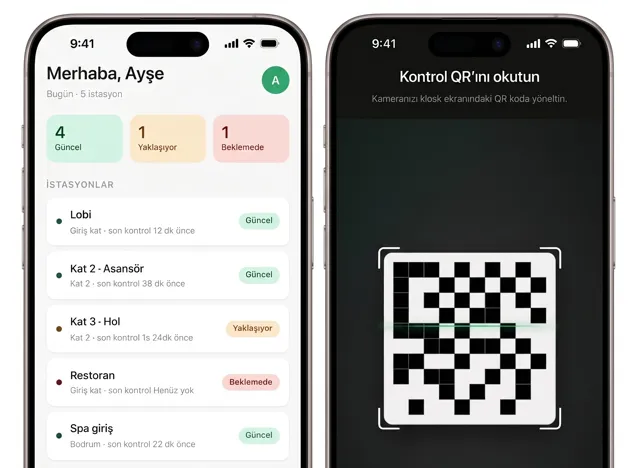
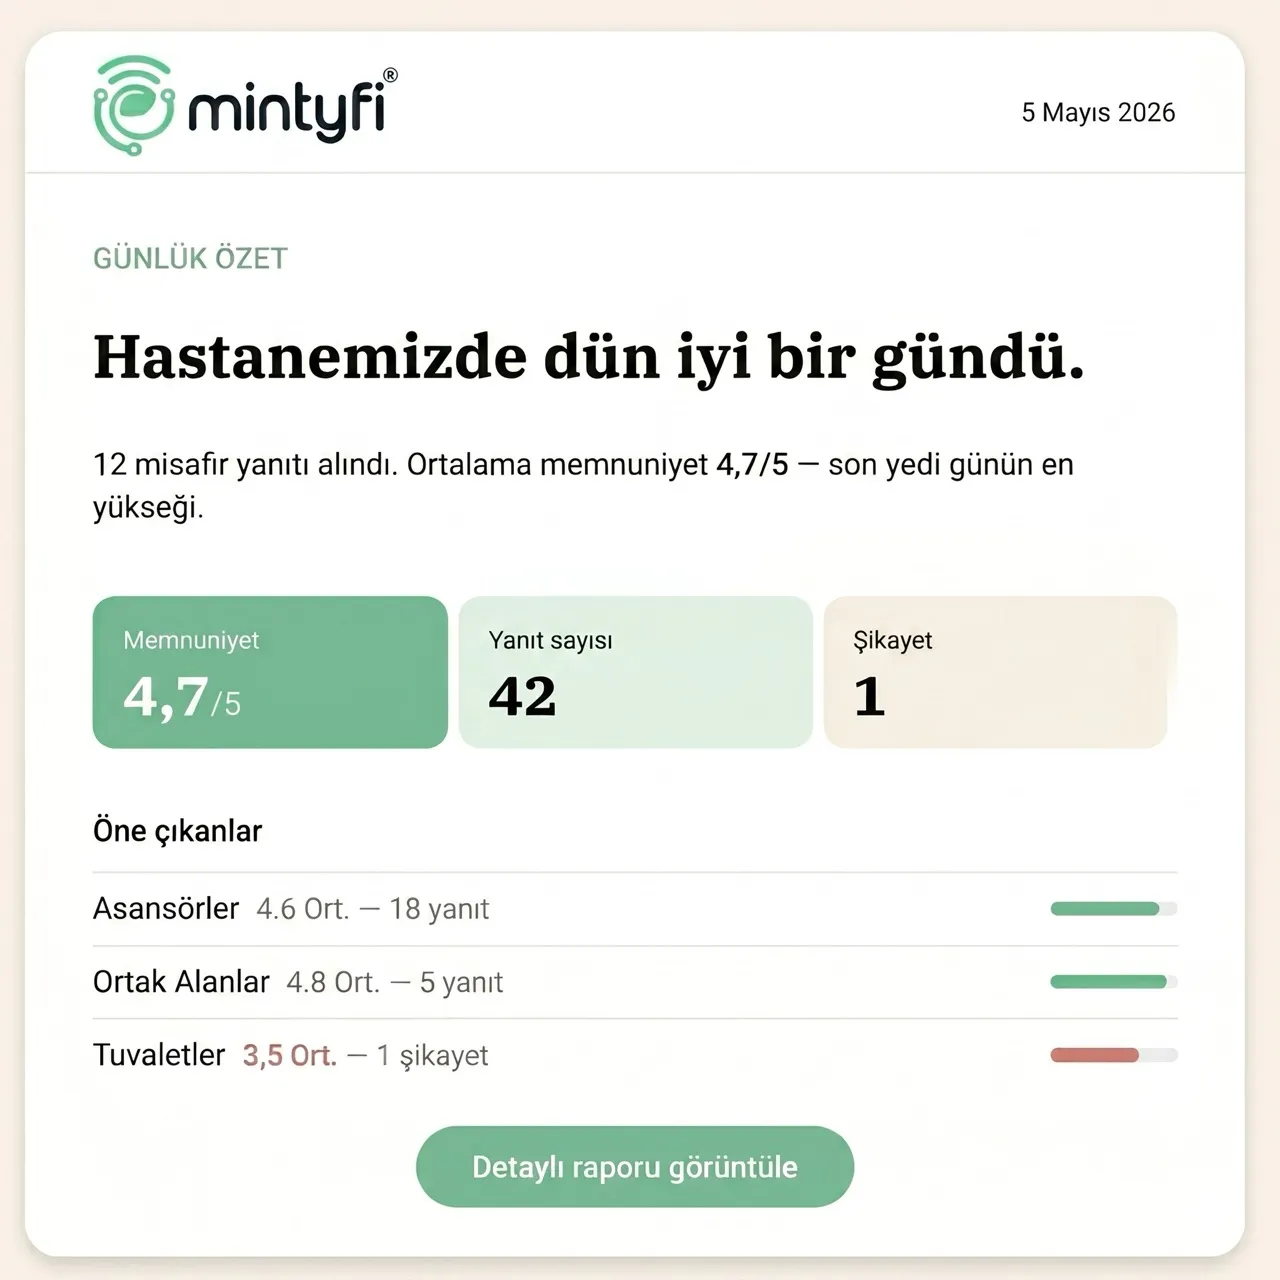
The dynamic code at the field point, the staff member's task screen and the manager's daily report meet in one record chain.
Make service continuity visible
Leave your details and we'll call you. Together we'll define the right scope for your team, your critical service points and your quality expectations.
E-mail: sales@mintyfi.com
We use cookies for visit statistics. Cookie policy