
SCQ · Service Continuity & Quality · by Mintyfi
“Done” is not enough. Prove it.
Verify that staff are at the right point, open the right form and record every check item and measurement. A nonconformity instantly becomes a work order, and every record becomes a result management can see.
- Physical presence
- Time and user
- Photo evidence
- Work orders with SLA
Verification chain
From task to proof, from proof to action
- 01 / 06
Plan
Define checkpoints, forms, task owners and how often each check repeats.
- 02 / 06
Verify
Staff scan the dynamic QR code at the point they are standing at with their mobile device.
- 03 / 06
Prove
Complete the form in full with photos, location, time and user details.
- 04 / 06
Act
Turn nonconformities into automatic work orders and route them to the responsible team.
- 05 / 06
Track SLA
Follow response and resolution times against targets in real time.
- 06 / 06
Report
Manage performance, trends and audit evidence from one place.
A real operation scene
Watch a technical check flow from the field to management.
A shift that starts at one facility point moves through QR verification, the field check, a work order and the management record. Click through the scene.
Interactive demo toolFollow the prompts and click to try it.
Live shiftMain Facility · Floor plan
Shift 1 07:30
Pick a task, choose a field staff member and assign it.
Management view · task list
| Task | Point | Staff | Start | Status | Result | Action |
|---|
Complete the assigned task step by step on the field phone.Go to the live QR demo
Live demo · try it yourself
See step by step how one QR scan reaches management.
Pick the task, scan the code on the wall and fill in the checklist. Mark one item “fail” and a work order opens by itself. Then rate the same point as a visitor.
Interactive demo toolFollow the prompts and click to try it.
1 · Field point (on the wall)
The code keeps changing (every 60 s in the field). A photo of it cannot be scanned from elsewhere.
2 · Staff app
3 · Manager view (live)
- 0/5
- Up-to-date points
- 0
- Late/pending
- 0
- Open work orders
The Floor 3 check has been waiting for 45 minutes
The manager sees it before a complaint arrives. The alert closes when the staff member opens the task and scans the QR.
Screens are adapted from the real field flow of the SCQ product.
What changes in operations?
Not watching staff, standardising the operation.
SCQ proves that the service took place and measures the result with visitor feedback. That distinction shows managers the right action.
- 01
Operational visibility
Which task is done, which is late, where is there a nonconformity? At a glance.
- 02
Verified service
Who did which check, where, when and with what result? Answered by a digital record.
- 03
Standard field procedure
Mandatory items, measured values, pass/fail and photos. Checks become a procedure, not a habit.
- 04
Closed-loop action
Detection, notification, assignment, intervention, resolution, closure. No nonconformity gets lost.
- 05
Was it done? How was it found?
Operational verification proves the work was done; the quality layer measures the user's experience. Both meet at the same point.
- 06
Early intervention
Not after a complaint: managers know the moment a delay or nonconformity occurs.
- 07
Audit and SLA/KPI evidence
Measure service provider performance with reliable data by time, location and outcome.
-
Which one is your priority?
See the flow for your facility
Closed loop
A nonconformity doesn't stay where it was found; it is tracked until it is closed.
- 01
Detection
Failed check item + photo
- 02
Notification
Instant alert to the manager
- 03
Assignment
Responsible team + SLA time
- 04
Intervention
Proof of the fix on site
- 05
Closure
Record ready for audit
Two data layers at the same point
Was the task never done, or was it done but not good enough?
The same QR opens task verification when staff scan it, and a feedback form when a visitor scans it.
| Continuity · Task | Quality · Experience | What the manager sees |
|---|---|---|
| Not done | Low | Operational problemPlanning, shifts or task tracking are reviewed. |
| Done | Low | Quality problemStandards, supplies or footfall are reviewed. |
| Done | High | Service verifiedThe record stands as evidence in the SLA/KPI report. |
OPERATIONS / OVERVIEW
Today's field view
- Completed
- 1,248
- +8%
- Open actions
- 12
- 3 critical
- Active points
- 148
- 6 locations
Weekly verificationsLast 7 days
SLA
Above target
Latest verificationsLIVE
Live operations centre
See what is happening in the field on one screen.
Track completed, late and nonconforming tasks by location and team. The weekly verification chart and SLA result explain where the operation is heading in the same view.
- Live performance and task status
- Weekly verification trend
- Work order and SLA tracking
- Audit-ready operation record
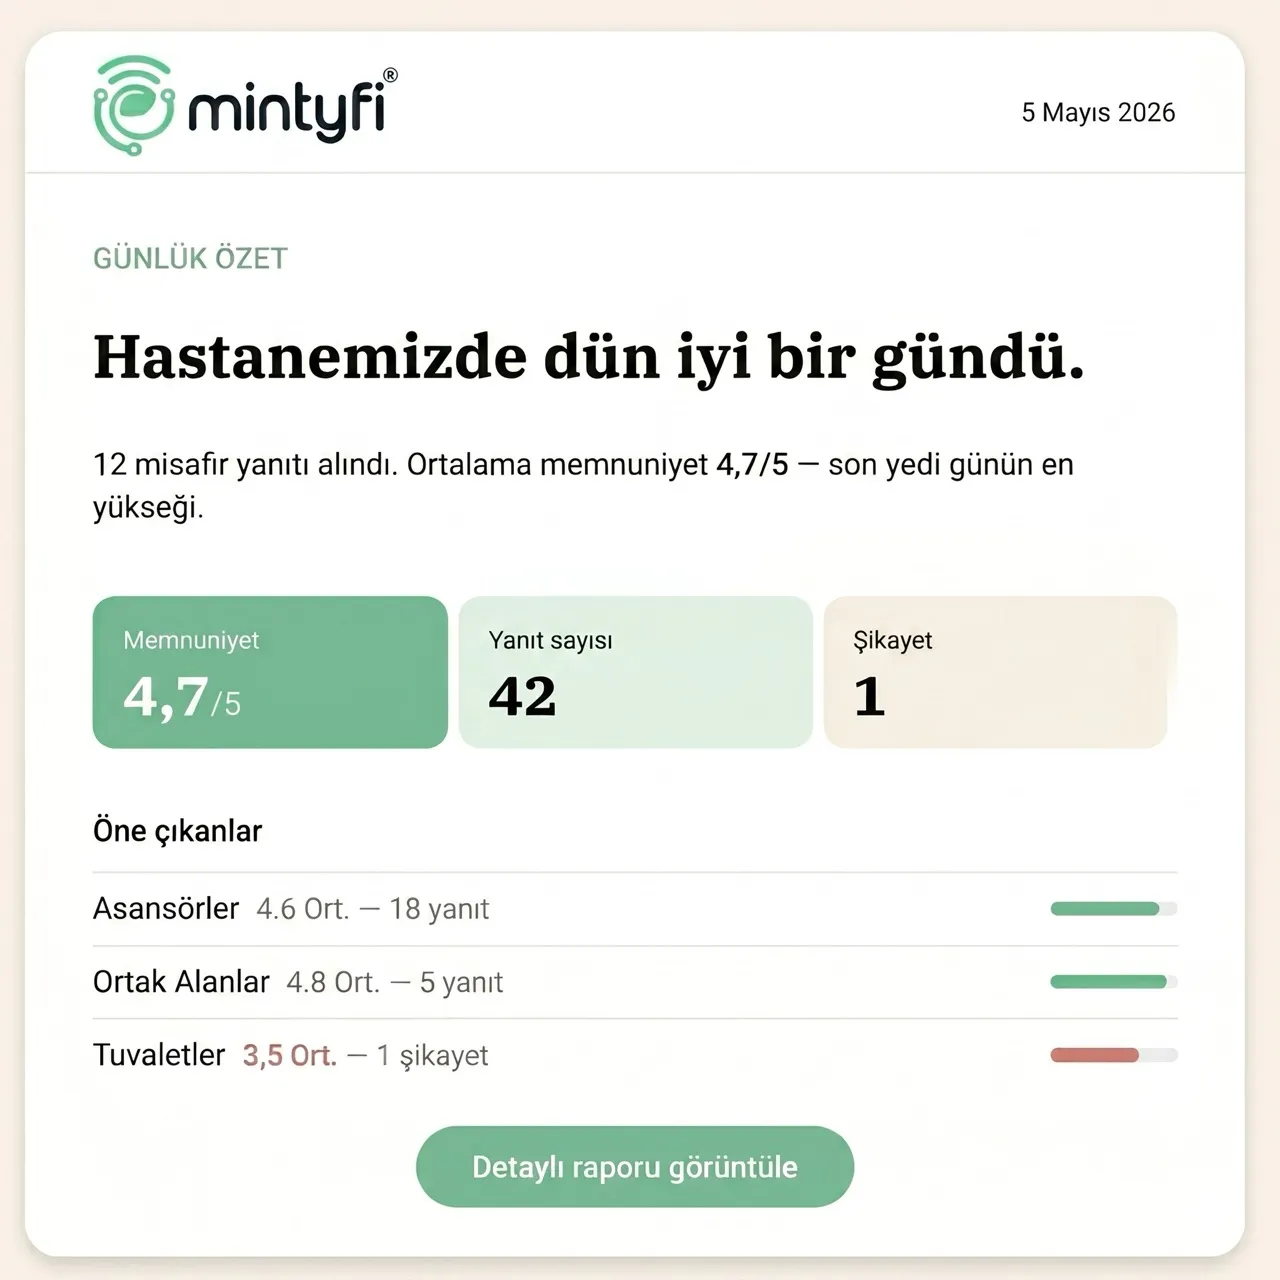
Outputs
Every scan becomes a reportable record.
- 01Time-stamped log per task
- 02Completion rate per station
- 03Shift and team performance
- 04Number, duration and recurrence of delays
- 05Digital proof for audits
- 06Work order and resolution times
Flow suggestion
See the service continuity and quality flow for your facility.
Continuity risk
In heavily used patient and visitor areas the service standard can slip quickly, even when a task record exists.
“Was the critical area checked on time, and how did users experience the same area?”
Critical service points
- Outpatient and waiting area
- Restroom and hygiene point
- Technical space and support area
Suggested field flow
- 1
Verify the right area with a dynamic QR
- 2
Record the hygiene form, measurements and photos
- 3
Assign the nonconformity to a team with an SLA
- 4
Match patient relatives' feedback to the same location
Indicators to track
- Check completion rate
- Nonconformity resolution time
- 1–5 quality score per area
Detailed solution pages
Continuity risk
Many points and subcontracted teams mean a skipped task is only noticed at the end of the shift.
“On which floor, in which shift and at which service point did continuity break?”
Critical service points
- Common areas and restrooms
- Lifts and escalators
- Technical rooms and energy points
Suggested field flow
- 1
Link shift tasks to locations
- 2
Verify the staff member's physical presence
- 3
Notify the manager of delays instantly
- 4
Compare the visitor signal with the task record
Indicators to track
- Number of late tasks
- Completion per shift
- Recurring problem points
Detailed solution pages
Continuity risk
Small deviations in room and common-area checks show up directly in the guest experience.
“Was the service done, and if so, did the result meet the quality the guest expects?”
Critical service points
- Room preparation
- Lobby and common areas
- Technical fault points
Suggested field flow
- 1
Open the room or area task with a QR
- 2
Complete the standard checklist
- 3
Route the gap to the right department
- 4
Combine the guest rating with the operation record
Indicators to track
- Room preparation cycle time
- First response time
- Quality trend per area
Detailed solution pages
Continuity risk
A periodic check closed at the wrong point or with missing data creates operational and audit risk.
“Was the right equipment really checked at the right time, with the mandatory measurements?”
Critical service points
- Equipment and meter points
- Periodic maintenance route
- Critical technical area
Suggested field flow
- 1
Verify the equipment with a dynamic QR
- 2
Make measurements, checks and photos mandatory
- 3
Turn out-of-limit values into actions
- 4
Keep the audit record tamper-proof
Indicators to track
- Planned check compliance
- Number of out-of-limit measurements
- Action closure time
Detailed solution pages
Continuity risk
Large areas and high task volumes make delays and gaps in responsibility hard to see from the centre.
“Which of the distributed teams fell behind the critical service level?”
Critical service points
- Terminal and transit areas
- Sanitation points
- Technical and outdoor areas
Suggested field flow
- 1
Split points by zone and service level
- 2
Verify the field visit with QR and location
- 3
Match delays to teams and SLAs
- 4
Compare stations in the central view
Indicators to track
- SLA compliance per zone
- Age of open work orders
- Team and shift performance
Detailed solution pages
Make service continuity visible
Let's plan a pilot for your operation.
Leave your details and we'll call you. Together we'll define the right scope for your team, your critical service points and your quality expectations.
E-mail: sales@mintyfi.com